Simplague
#simplague
Try this first: http://simplague.space/examples/index.html Or try out the site: http://142.93.60.94/examples/index.html (hopefully it works, if not we are working on it :) )
- Working on getting the website on domain: simplague.space
- Domain is powered by domain.com
- Site is hosted by Digital Ocean Droplet (nginx)
- Warning: loading times may take a couple of seconds
Inspiration
Nearly 7 million people are affected by COVID-19 in our world. Of that population, 500,000 people have died. This disease is even deadlier than the common flu.
This leads us to the question: How can we prevent the population from spreading any disease in an engaging and educative way?
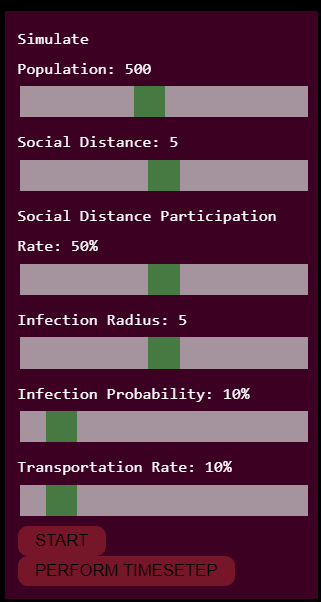
In our modern world, we are currently facing a large scale pandemic, COVID-19. However, every now and then, we see people around the world not following various social distancing guidelines. Also with different disease characteristics, it's hard to find how people should behave during these times. Therefore, we decided to create a global simulation of any disease and population by manipulating various characteristics such as infection radius, infection probability, and participation rates. By showing the amount of deaths caused by you, the users, we want to encourage the user to follow various health guidelines.
A popular game that many people have played via mobile applications, popularly known as PlagueInc. The goal of this game is to infect the entire world via simulation by manipulating various disease characteristics. However, we wanted to create another version of this, but more user-based. We tried to make the simulation as personal as possible with soft music and allowing the user to control both population characteristics and disease characteristics. With, this emotional impact created by this simulation, we hope to impact users to become more hygeinically aware and try to protect their health more.
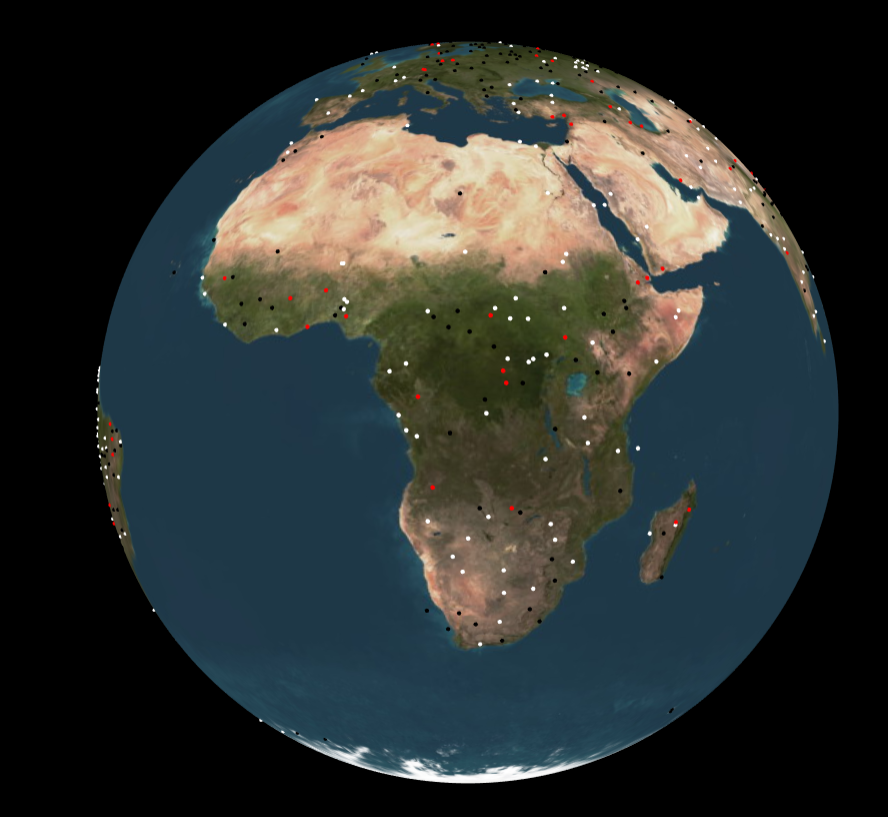
We were also inspired by Google Earth and various 3D renderings of the Earth. We wanted to create a simulation with user interaction to help users have a good user interface and able to attain knowledge in a new and engaging way. We rendered a globe as well with randomly generated populations to create this similar interface.
What it does
Our site is an interactive simulation site of the world to simulate any pandemic.
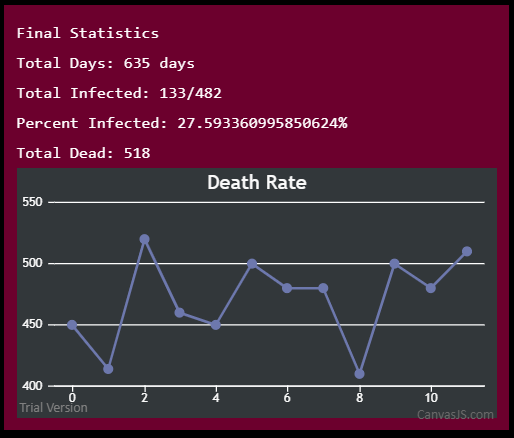
Upon reaching the site, the user is presented with a loading animation to introduce them to the application. Next, the user is able to manipulate different variables on the left panel. Then, the user watches the globe change its features as the virus spreads. Finally, the user is presented with data regarding the simulated virus and its impact on the population.
The website plays audio in the background to bring the emotional aspect out of the user. The site also allows for the user to rotate the globe to view various parts of the Earth and its spread. In the back-end, the program calculates which users are infected and which users are not infected based on the various manipulative factors. We created an algorithm based on the research found by [3Blue1Brown] (https://www.youtube.com/watch?v=gxAaO2rsdIs&t=370s****).
How I built it

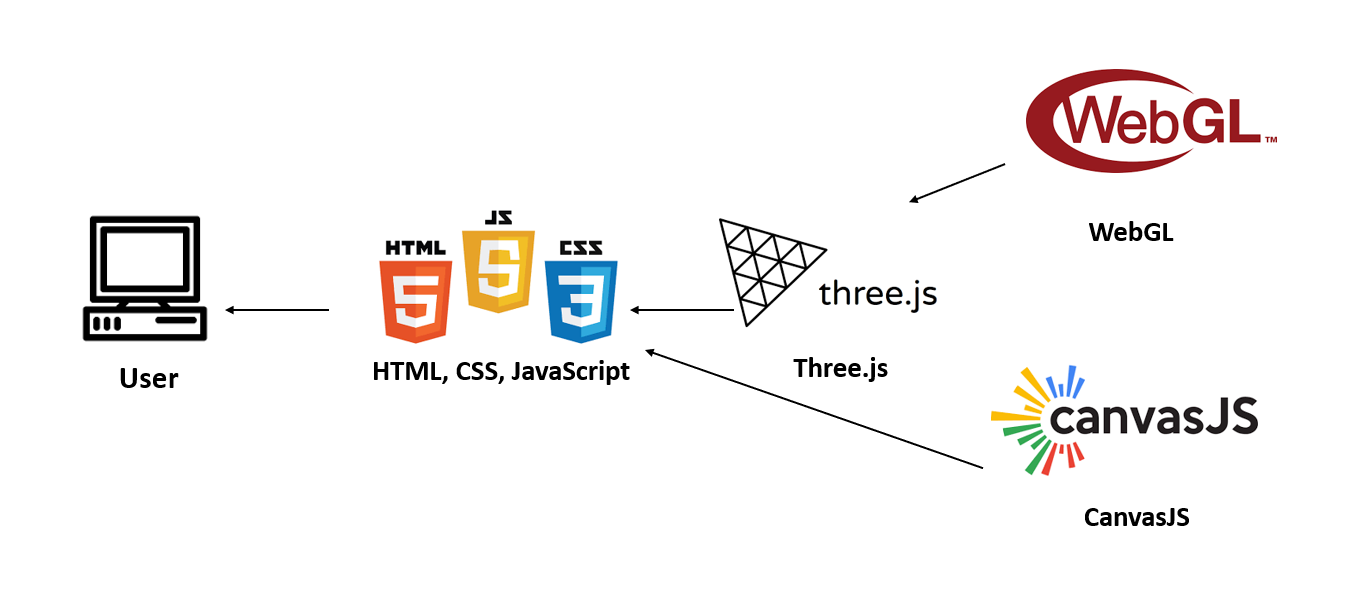
Three.JS: This was our first time ever using Three.JS. We used this as our browser based rendering engine. We looked at examples online of three.js projects and were inspired to create an interactive user interface. It is able to work with WebGL to create 3D rendered models.
WebGL: This was our first time ever using WebGL. Specifically, we used this to create shaders. We originally wanted to color different parts of our globe red to show infections. This is also used manually by Three.JS.
HTML, CSS, JS: These are basic tools used to render a webpage. We used them to build our UI with sliders and visual graphs.
Canvas.JS: We used CanvasJS to generate the death graph per day. We will be able to create multiple graphs and statistics using this module.
Challenges I ran into
One of the issues we ran into was how to create the globe. Even if we created the globe, how would we know where to put each person. Our solution to this problem was to color map land to water in order to put different people in random locations.
Another problem was computation time: each 5 days runs O(n^2) time complexity to calculate infection. This means that we cannot handle large population sizes for rendering. It will take a longer time to load than it already is taking to load.
Our experiences in these languages, 3D modeling/rendering, and web hosting was very limited within our team. We had to learn many of the skills on the spot. We tried hosting our website on a DigitalOceanDroplet with a domain name from domain.com.
Accomplishments that I'm proud of

We were able to 3D render our world. We are able to manipulate various virulent factors to impact the population. We are able to properly render the transportation and disease infections based on color. We are able to compute social distance with global arc length and linear algebra.
We were able to create user interactivity with music and sliders. This makes the interaction more engaging and enjoyable. The fact that we are able to compute large-scale calculations in a spherical coordinate system with a 2D screen using linear algebra, just amazes us as we hope it amazes you too.


What I learned
We learned how ThreeJS works and how shaders work together to color different parts of the program. Also, we also learned linear algebra used to calculate social distancing in the global environment.
We also learned the mathematics behind how a virus variables affect the way it infects people. Finally, we learned how 3D rendering works with perspective, lighting, and movement functions.
Finally, we learned how big of a loading time THREE.js takes to load the website. It takes a while to render based on the amount of computations we use.
What's next for simplague
- Control over the population
- Shorter loading times
- Show effects of cures found
- Display graphs for visuals, with realtime data
Resources:
https://www.worldometers.info/coronavirus/
https://www.youtube.com/watch?v=gxAaO2rsdIs&t=370s**** (description has more resources)
e used React.js for the front end, and Node.js, Express.js, and MongoDB for the back end.